Chapter 5 Results
5.1 Service Activation Transition Rate
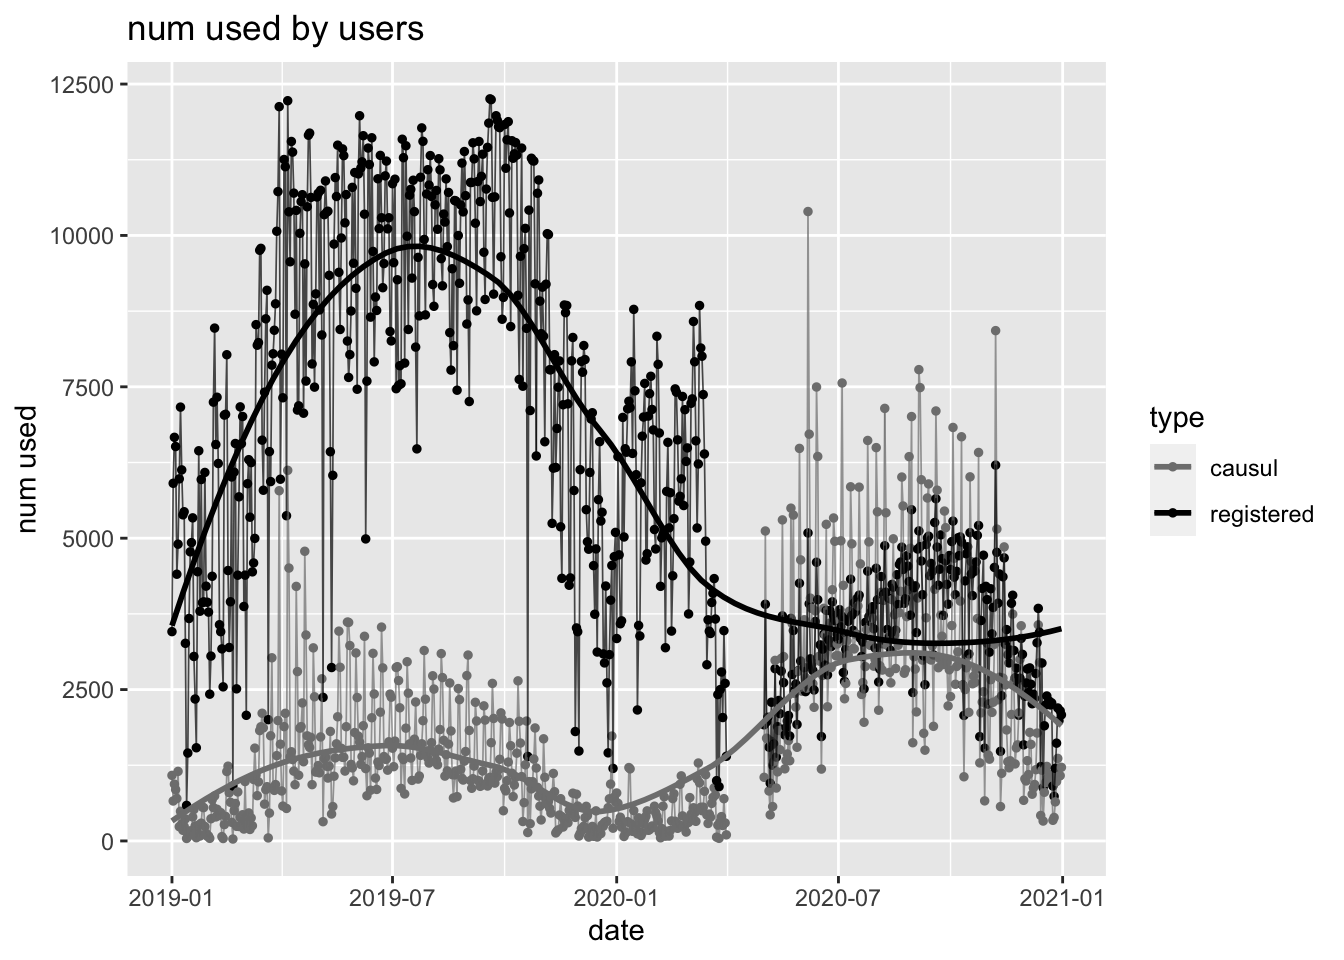
The figure shows that both registered and causul users use Capital Bikeshare most in 2019 summer and least in 2019 winter and 2020 winter , while the number of use by registered users is far higher than that by causul user. It indicates that during the cold days in winter, bike may not be people’s priority choice when going outside. Thus if they have to do so, such as commute, they would probably incline to registered since it is more economy preferable in consideration of long term and fixed usage frequency.
And in warm days during the summer(2019), bike is quite popular and the number of used reach its peak then. Just as what indicated by the “Report on the current situation of global and Chinese bike sharing market in 2020 and its future development trend”, people may accidently (causul users) or mean to (registered users) use Capital Bikeshare service for leisure purpose during the warm days.
However, this story changed in 2020, perhaps due to the influence of Covid-19, the number of used by registered users decrease sharply while the number of used by causul users increased significantly. The authors infer that due to the Covid-19, people rather to stay at home for most of the time and therefore, a large amount of registered users may quit their membership in Capital Bikeshare for the sake of economy (there are 3 types of membership for Capital Bikeshare, Annual Member, 30-Day Member and Day Key Member, each would charge a fixed fee), and become causul users when they have to go outside.
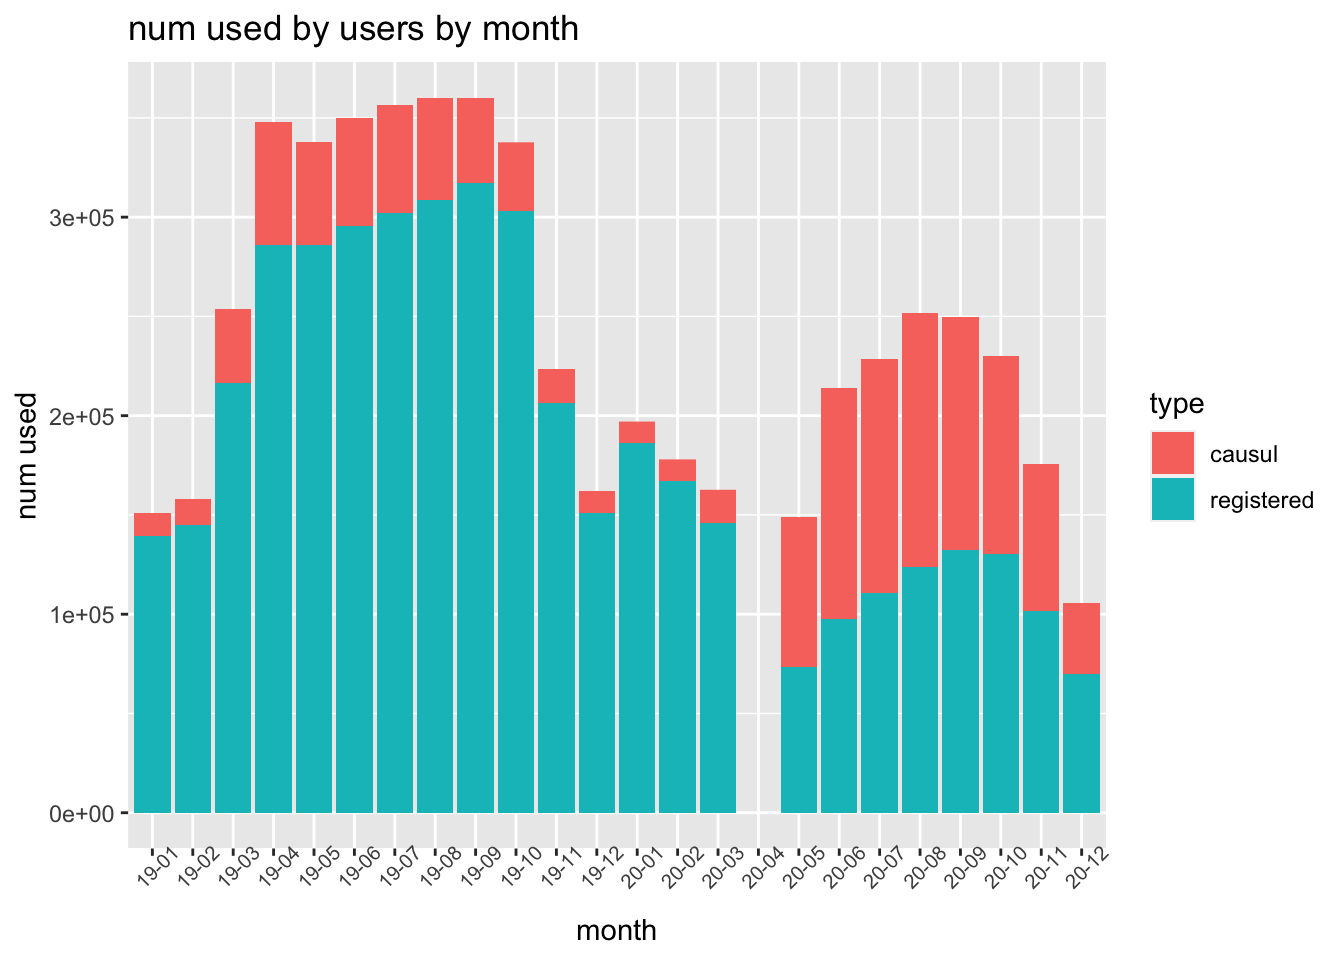
The implication from this figure is aligned with what we obtained from the previous plot. And the proportion of causul users during the warm days of 2019 does increase (indicate more free and diversified use scenarios). Besides, the negative impact of Covid-19 is also quite obvious in this plot, it show that the number of used by both causul and registered users together is substantial lower compared with the same period in 2019 during summer and fall (also the worst period of covid-19).
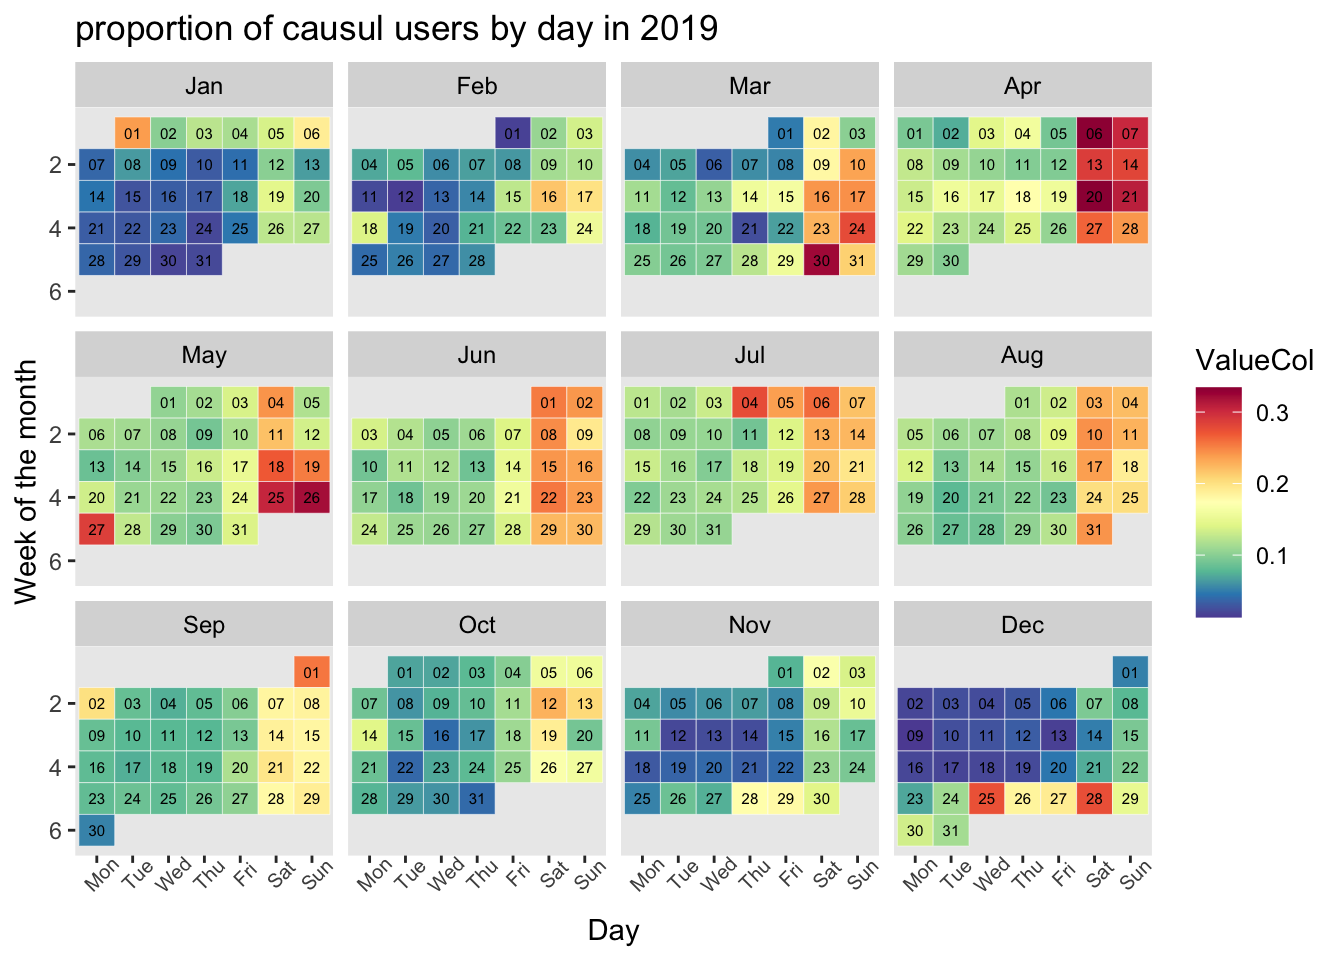
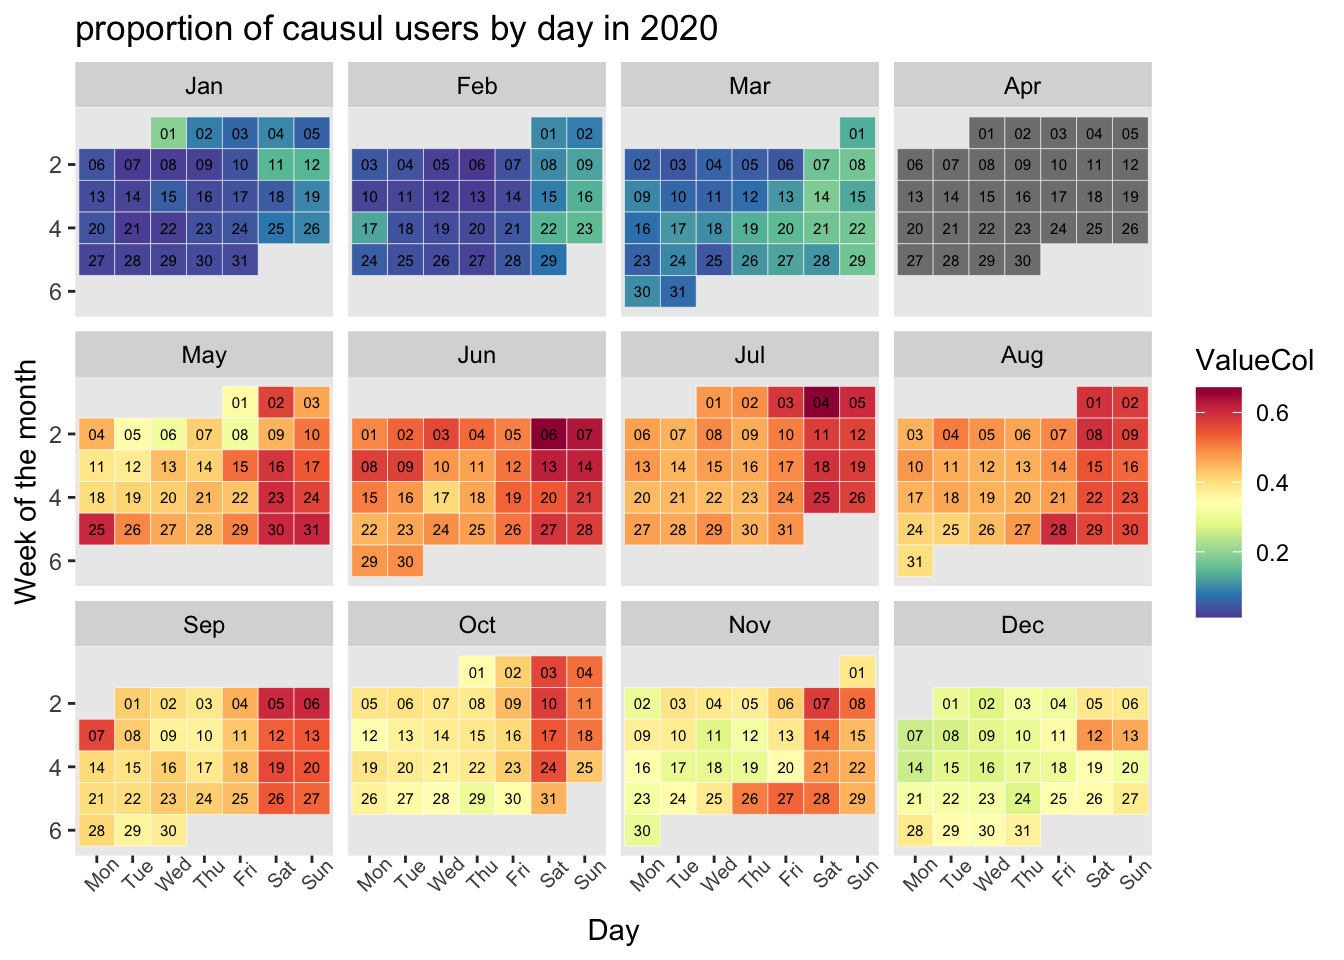
We also draw the heatmap according to proportion of causul users by day in 2019 and 2020. We notice that irrespective of the impact of Covid-19 or seasonal factors, causul users make up a higher proportion during the weekends, which make our discussion towards 2 previous plots more valid. That is, during the weekdays, a large proportion of users are registered users, who may apply Capital Bikeshare service for commute purpose. While during the weekends, people use them more casually, and perhaps exactly as what we have commented, for leisure use, just as the use scenarios that has been figured out in Italy.
5.2 Deciding-Factor Analysis
We want to explore how total rental amount of bike-sharing relates to each variable. Since variables are not the same type, we would split them into quantitative varibles and qualitative varibles and analyze seperately.
5.2.1 Quantitative-Varible Analysis
min_temp (daily minimum temperature); max_temp (daily maximum temperature); max_steady_wind (maximum steady wind of the day); total_daily_precipitation (total daily precipitation).
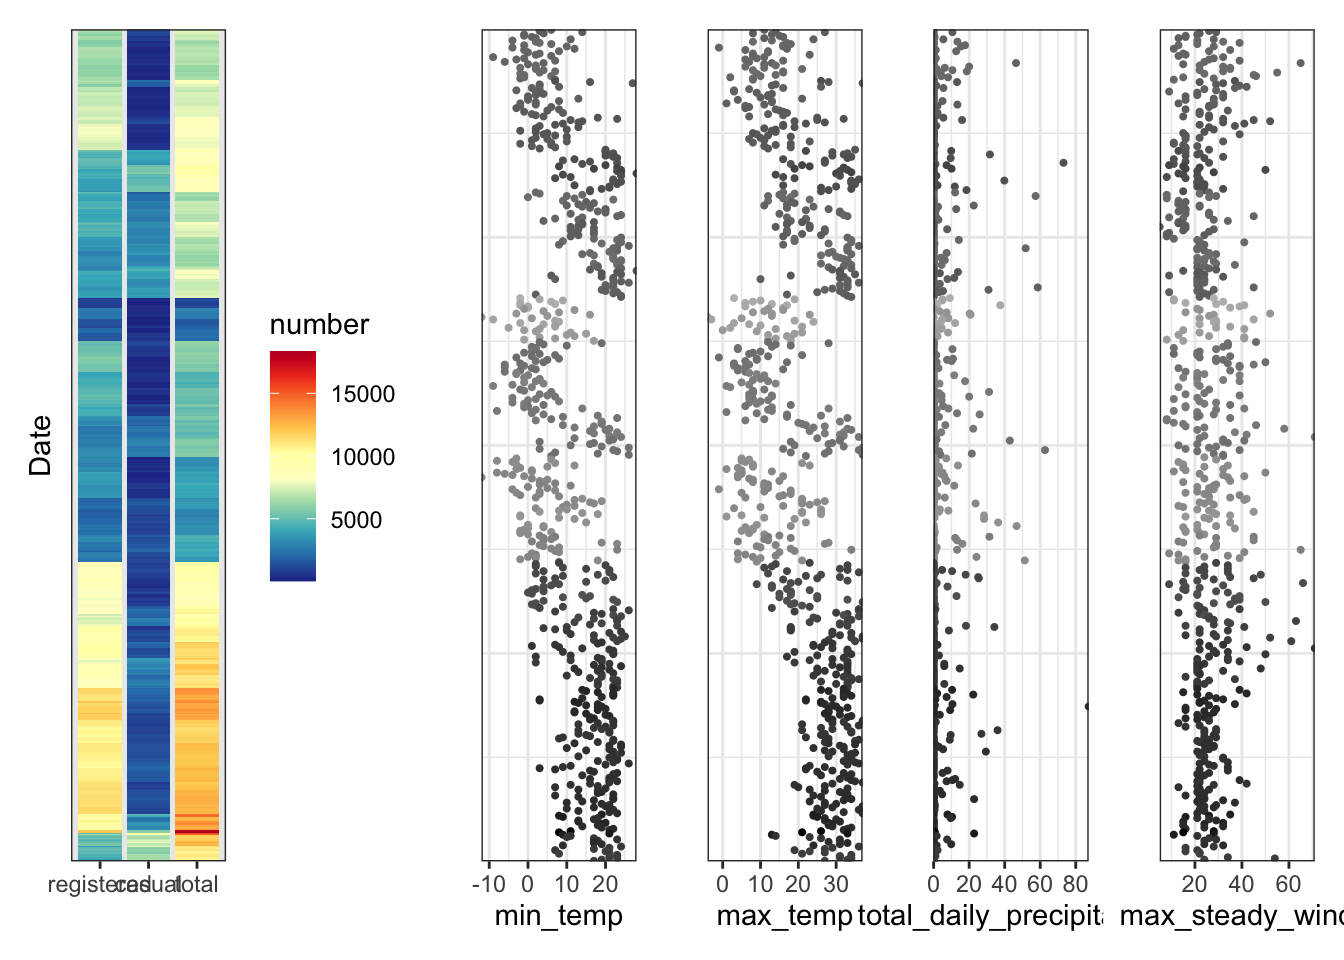
Heatmap on the left shows such three main clusters/groups of bike-sharing rental amount as High rental amount, Low rental amount and Medium rental amount (from bottom to top). Accordingly, the right four scatterplots present how these three rental groups relate to each quantitative variables. Note that the transparency of data points represents the magnitude of total rental amount: the more total rental amount each point holds, the darker it will be. Based on the plots, it is clearly observed that:
More bike-sharing activities took place when temperature was above 20 degrees Celsius (68 degrees Fahrenheit) and less people cycled when it was cold, especially when temperature was subzero. People prefer to rent and ride bicycles on non-rainy days with precipitation below 10mm. Noticeable, some users did enjoy rainy-cycling with precipitation above 20mm and few users even choose the service when it rained over 70mm. Non-windy days with 15-30 km/h wind usually attracted more users to the bike-sharing service. Indeed, some users would choose the service when it blew at over 50 km/h.
5.2.2 Qualitative-Varible Analysis
Weekday (weekday of the date); Season; Description (weather type of the date).
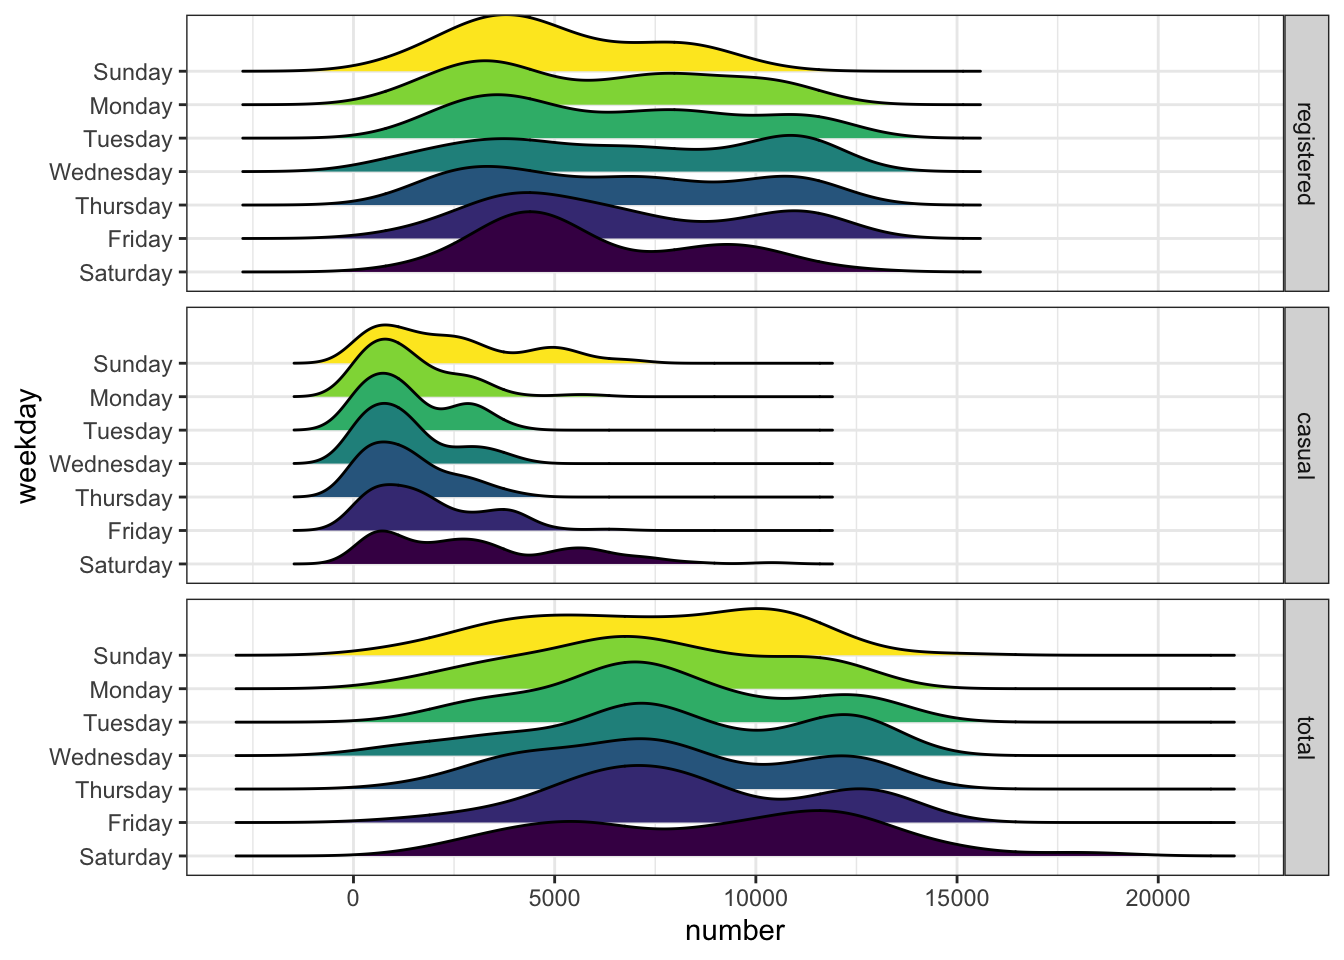
Based on the ridge-plots, we could observe that:
Saturday and Sunday tend to attract more users to cycle, whose distributions center on higher total rental amount (over 10,000). Noticeably, Monday through Friday almost have the same distributions, which may imply users’ daily commuting necessity.
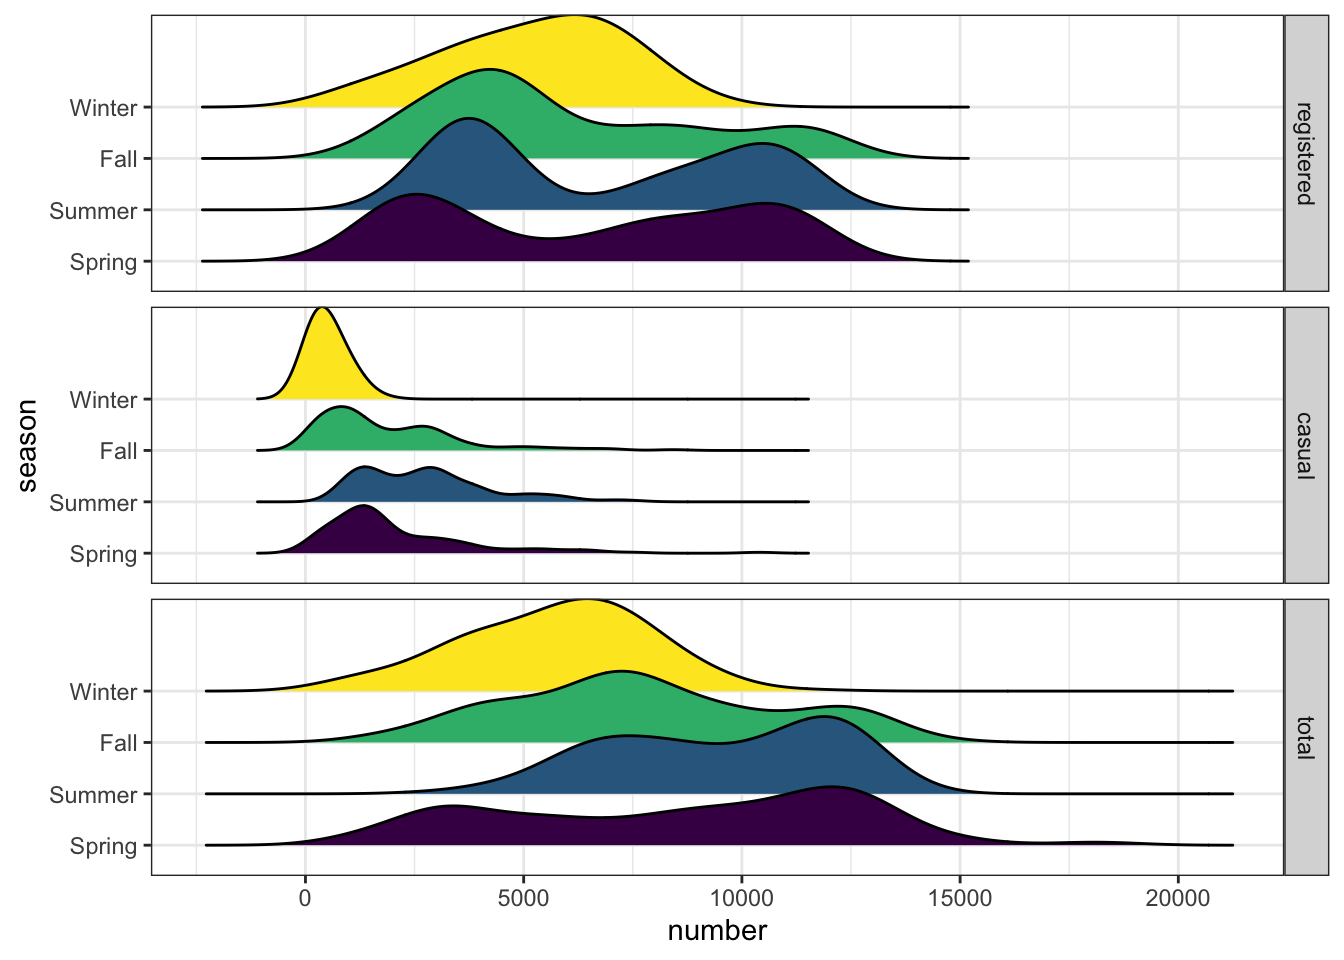
Spring and Summer are users’ favorite seasons to engage in the bike-sharing activiteis while Fall attracted certain amount of users as well. Besides, there was a great variation in Spring’s total rental amount, which implies the distinctive year-on-year decline in 2020, i.e. the Covid-pandemic year.
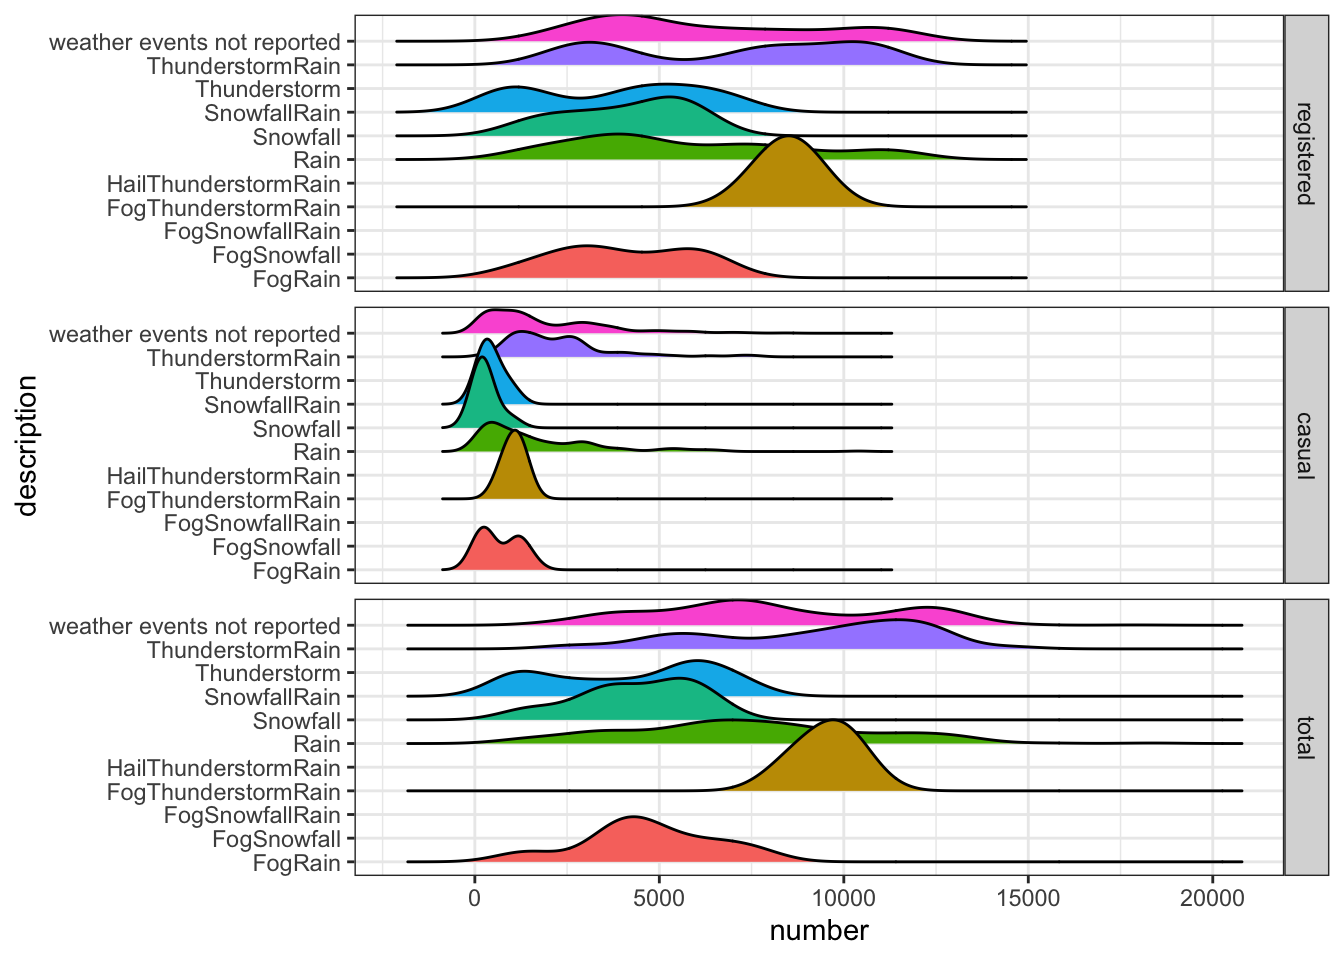
As expected, sunny days (Weather events not reported) are users’ top choices to ride bicycles while people cycled less on rainy and snowy days (Rain, Fograin, Snowfall, Snowfallrain). Surprisingly, thunderstrom days (ThunderstormRain and FogThunderstromRain) did not undermine people’s passion for bike-sharing and this phenomenon could be attributed to residents’ adaptation to frequent thunderstroms. Also, on thunderstorm days, for those who do not drive, cycling would become alternative commuting type to consider, given the shortage of ride-hailing vehicles due to increased demand.
5.3 Events/Holiday Detection
This is an extended version of the d3 plot in chapter 6, which could help us identify the specific dates with the peak bike sharing rides.
By moving the cursor on the interactive graph, we can observe that 2019-03-30, 2019-04-06, 2020-06-06, and 2020-11-07 are the four days with most bike sharing rides over the past two years, and we will analyze those dates with information from the CNN news, the New York Times and other online sources.
As we all know, Washington D.C. is famous for the cherry blossom near the Washington Monument, and people celebrate the National Cherry Blossom Festival every year from the last week of March into the first week of April. Unlike 2020, most of the people are not allowed to work from home or take a day off just to enjoy the bloom of the cherry blossom in 2019, so people are more likely to go together on the weekend. This explains why 2019-03-30 and 2019-04-06 are the two peak dates that people go out on street and take the bike sharing rides much more frequent than usual dates.
According to the CNN and New York Times news reports on June 6, 2020, Washington D.C. was having a protest on the death of George Floyd. The Washington’s mayor had “Black Lives Matter” painted near the White House and lead the protest. It directly lead to the peak in bike sharing rides since lots of people participated in the event and they all need a solution for the transportation.
The last peak day we observed from the past two years are November 7th, 2020. On November 7th, the Associated Press, Fox News, and the other major networks call Pennsylvania for Biden, thus putting him above the required 270 electoral votes to be named President-elect. Reacting to the news of Biden’s projected victory, his supporters celebrate in the streets of various cities across the country. At the same day, Trump proceeds with his legal challenges, and his supporters protest in various cities. As one of the crowded days in history, it’s reasonable that the bike sharing rides increase as a mean of transportation.